
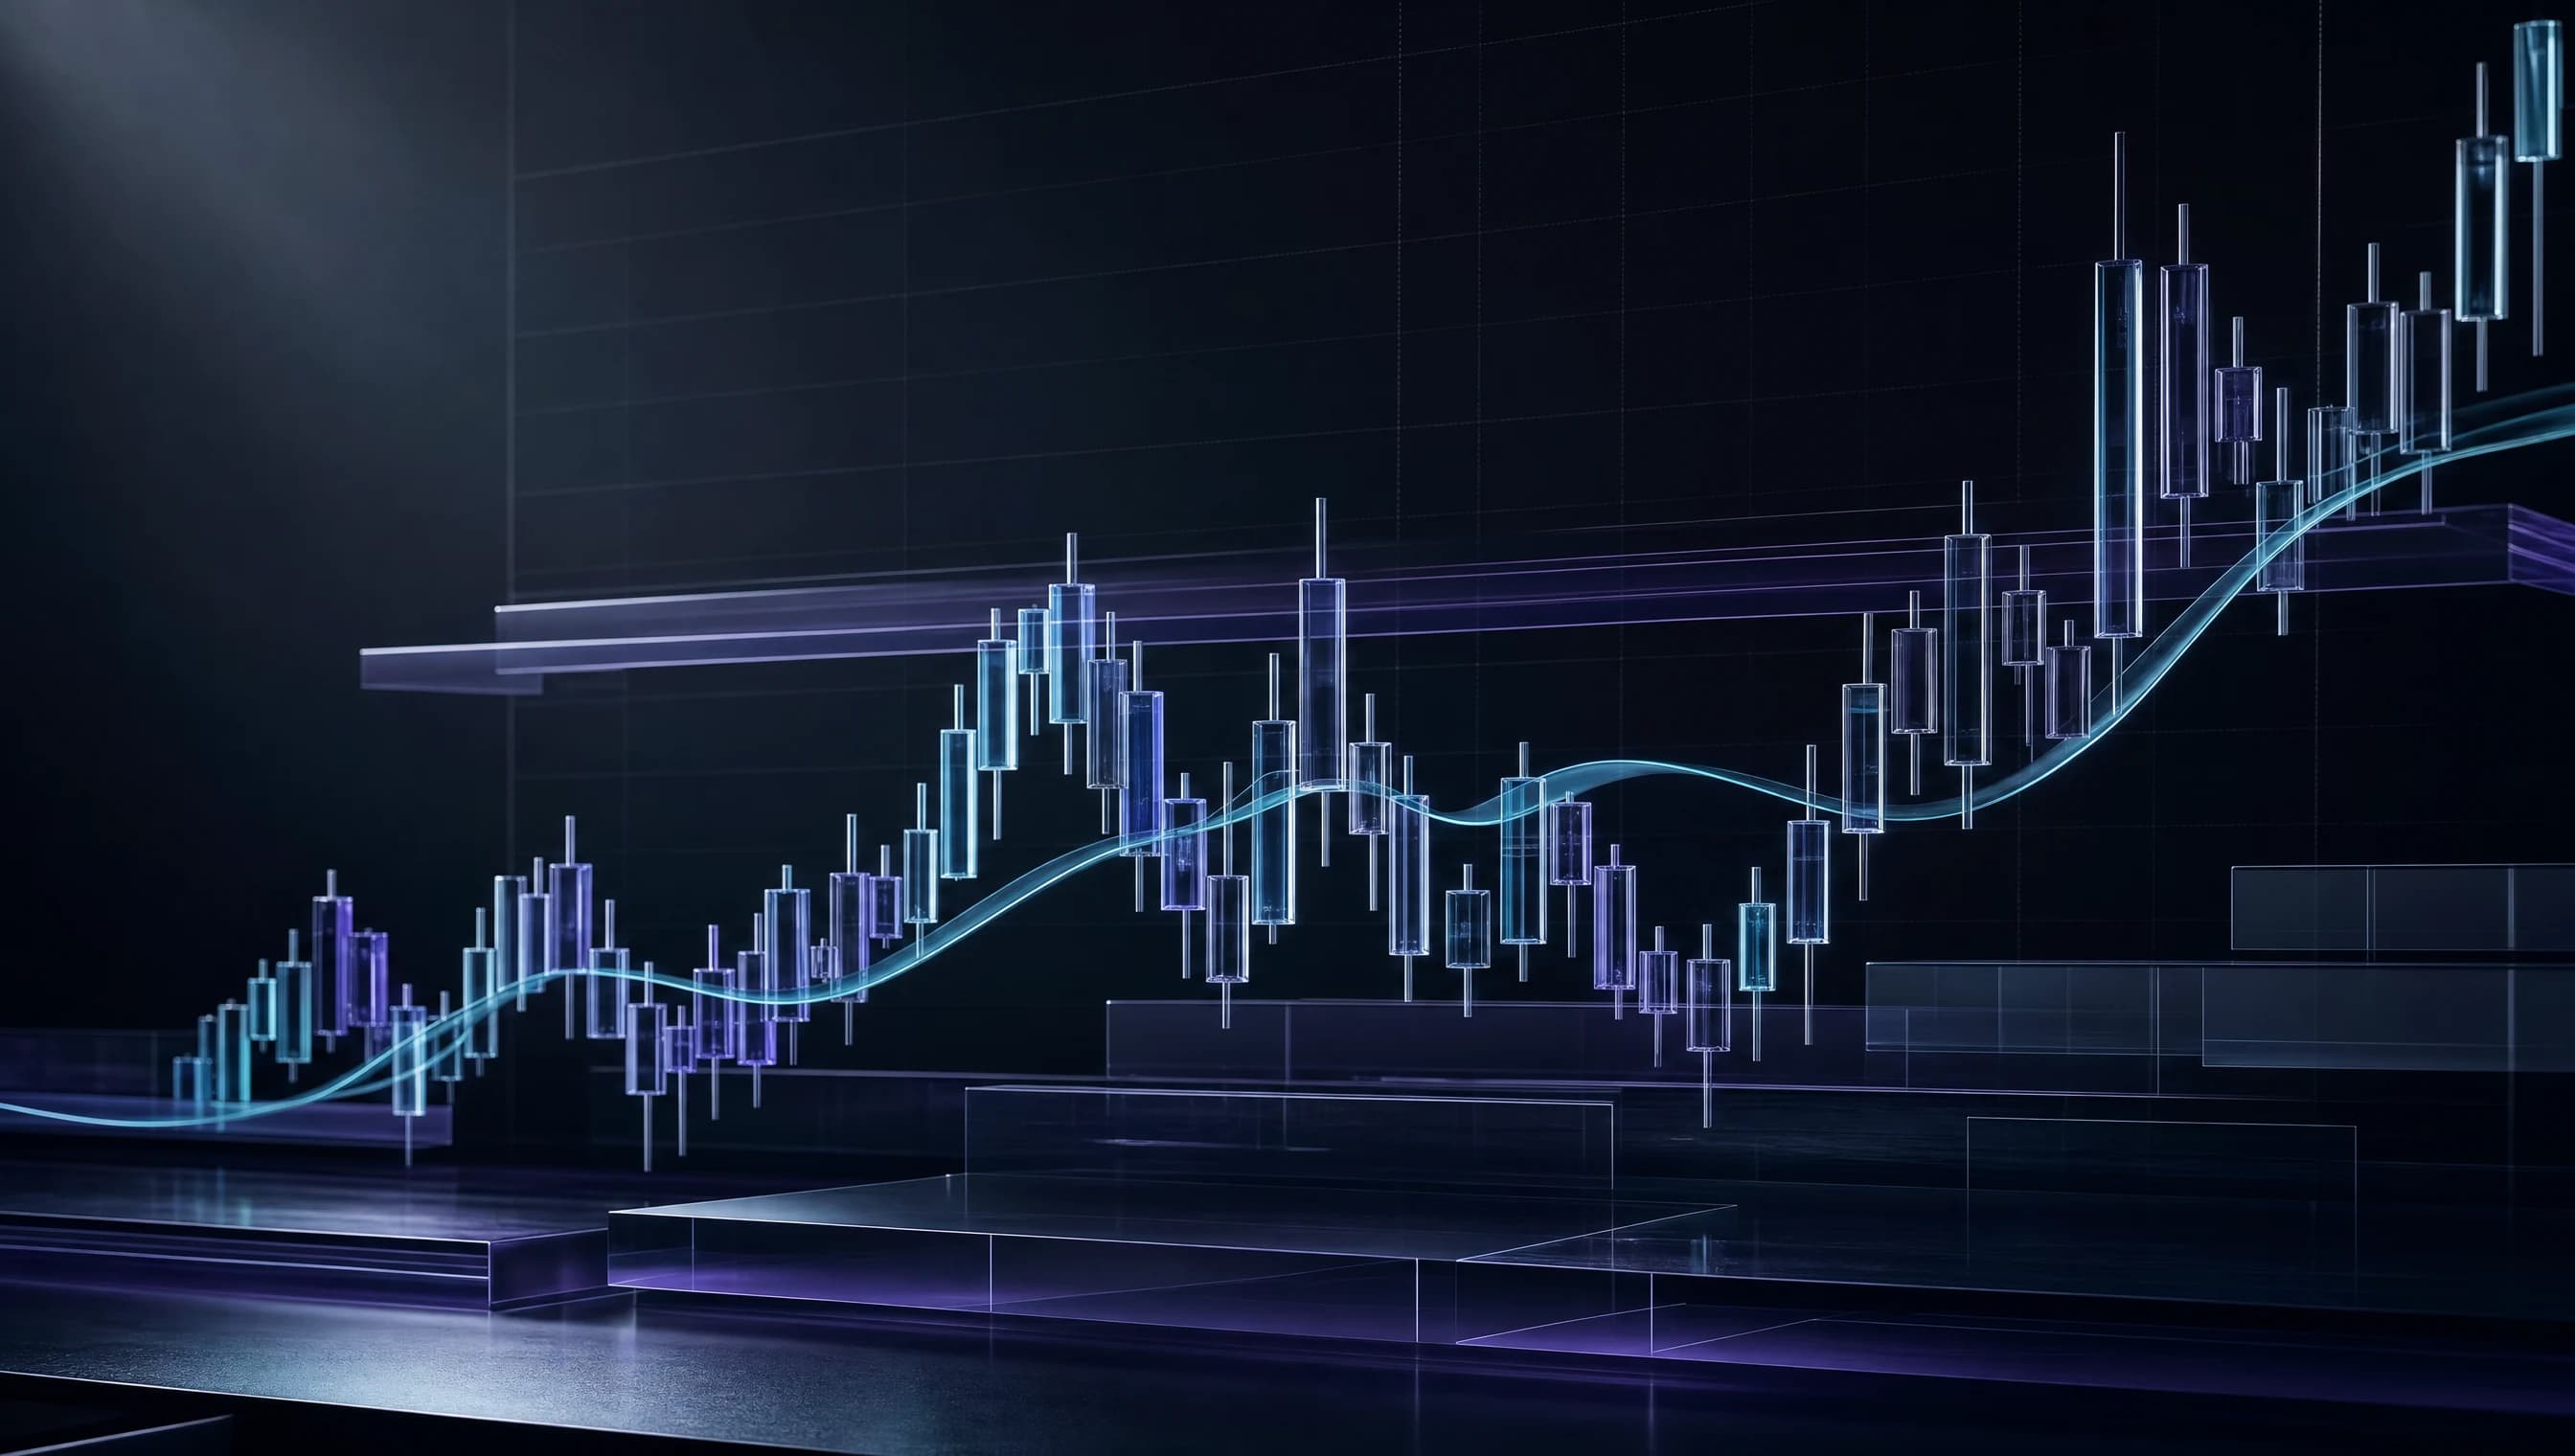
Illustrative chart
Candlestick OHLC Anatomy
What to notice
The body shows open-to-close change while the wicks show the full observed range for the period.
Common mistake
Naming a candle pattern without first checking location, trend, volume, and the next period.
A candlestick compresses four prices from one interval: open, high, low, and close (OHLC). Its shape shows where the period began and ended, how far price travelled, and where the extremes occurred. That is useful compression, but it is not a record of every intraperiod transaction. Different price paths can produce the same candle, so interpretation must stay conditional on location, sequence, and market structure.
Build the candle from OHLC
The body spans open to close:
Body size = absolute value of Close - Open
The upper wick runs from the higher of open or close to the high:
Upper wick = High - max(Open, Close)
The lower wick runs from the low to the lower of open or close:
Lower wick = min(Open, Close) - Low
Total range is High - Low. A close above the open is commonly colored as an up candle; a close below the open is a down candle. Color schemes vary, so OHLC relationships are more reliable than memorizing colors. When open and close are equal or very close, the body is small, often described as a doji under a chosen tolerance.
Compare proportions, not names alone
Body size relative to total range describes net movement within the interval. A large body and close near the high show that upward net movement retained much of the range into the close. A long upper wick shows that price traded higher but did not keep the full excursion. A long lower wick shows rejection or recovery from lower prices within that period.
Close location can be quantified:
Close location = (Close - Low) / (High - Low)
It equals 0 at the low, 0.5 at the midpoint, and 1 at the high. This measurement is undefined when high equals low. Proportions create reproducible descriptions and avoid forcing slightly different shapes into rigid pattern names.
Add timeframe and market context
The same geometry can mean different things at different locations. A long lower wick after a decline into a previously observed support zone provides different context from the same wick in the middle of a quiet range. A daily candle also hides the sequence visible on intraday data: the high may have occurred before or after the low.
Session definitions matter. A futures candle built from nearly continuous trading differs from a cash-session candle. Extended-hours equity data can change the open, high, and low. In around-the-clock markets, the selected daily cutoff is conventional. Gaps, auctions, thin trading, and one erroneous print can materially alter a candle’s appearance.
Worked example: two strong-looking candles
Suppose one period has:
Open 100, High 106, Low 98, Close 104
Its body is 4, each wick is 2, and total range is 8. The body occupies 4 / 8 = 50% of the range. Close location is (104 - 98) / 8 = 75%. The period finishes above its open and in the upper quarter of its range, while still showing meaningful movement on both sides.
The next period opens at 104, reaches 105, falls to 99, and closes at 100. Its body is 4, upper wick is 1, lower wick is 1, and range is 6. Close location is (100 - 99) / 6 = 16.7%.
Each candle has a relatively large body, but the two-period sequence begins at 100 and ends at 100. The second candle offsets the first candle’s net change. This example shows why one forceful shape cannot be treated as a durable directional forecast.
Practical candlestick checklist
- Verify OHLC data, timezone, session, adjustment method, and timeframe.
- Calculate body, wicks, range, and close location before assigning a pattern label.
- Compare the candle with recent typical range and volatility.
- Mark structural context such as trend, range edge, gap, or prior reaction zone.
- Use completed candles when a definition depends on the final close.
- State the confirmation and invalidation rules before the next period forms.
- Test pattern definitions with spread, slippage, and next-period execution.
A pattern name should be a compact description, not a substitute for measurable criteria.
Limitations and false signals
Candles discard intraperiod sequence and volume-by-price information. A long wick may reflect rejection, a brief liquidity vacuum, a news spike, or a bad print. Small samples make colorful pattern catalogs especially vulnerable to hindsight bias: analysts can find a named formation after almost any turn while overlooking identical shapes that failed.
Thresholds are subjective unless defined. How small must a doji body be? How long must a wick be relative to the body? Changing those answers after viewing outcomes overfits the chart. Patterns can also fail through gaps, and an order placed after confirmation may execute far from the candle’s close. Combining several candle names from overlapping bars does not create independent evidence because all labels reuse the same prices.
Key takeaways
- A candlestick summarizes OHLC data for one defined interval.
- Body, wick, range, and close location can be measured objectively.
- Identical shapes can arise from different intraperiod paths.
- Location, volatility, session rules, and surrounding candles provide essential context.
- Pattern names do not remove failure, timing, or execution risk.
This guide is general education, not personal investment advice or a recommendation. Candlestick patterns can fail, and gaps, thin liquidity, data errors, slippage, and leverage can cause losses that a completed candle does not anticipate.
Sources and further reading
Editorial review completed 16 July 2026.