
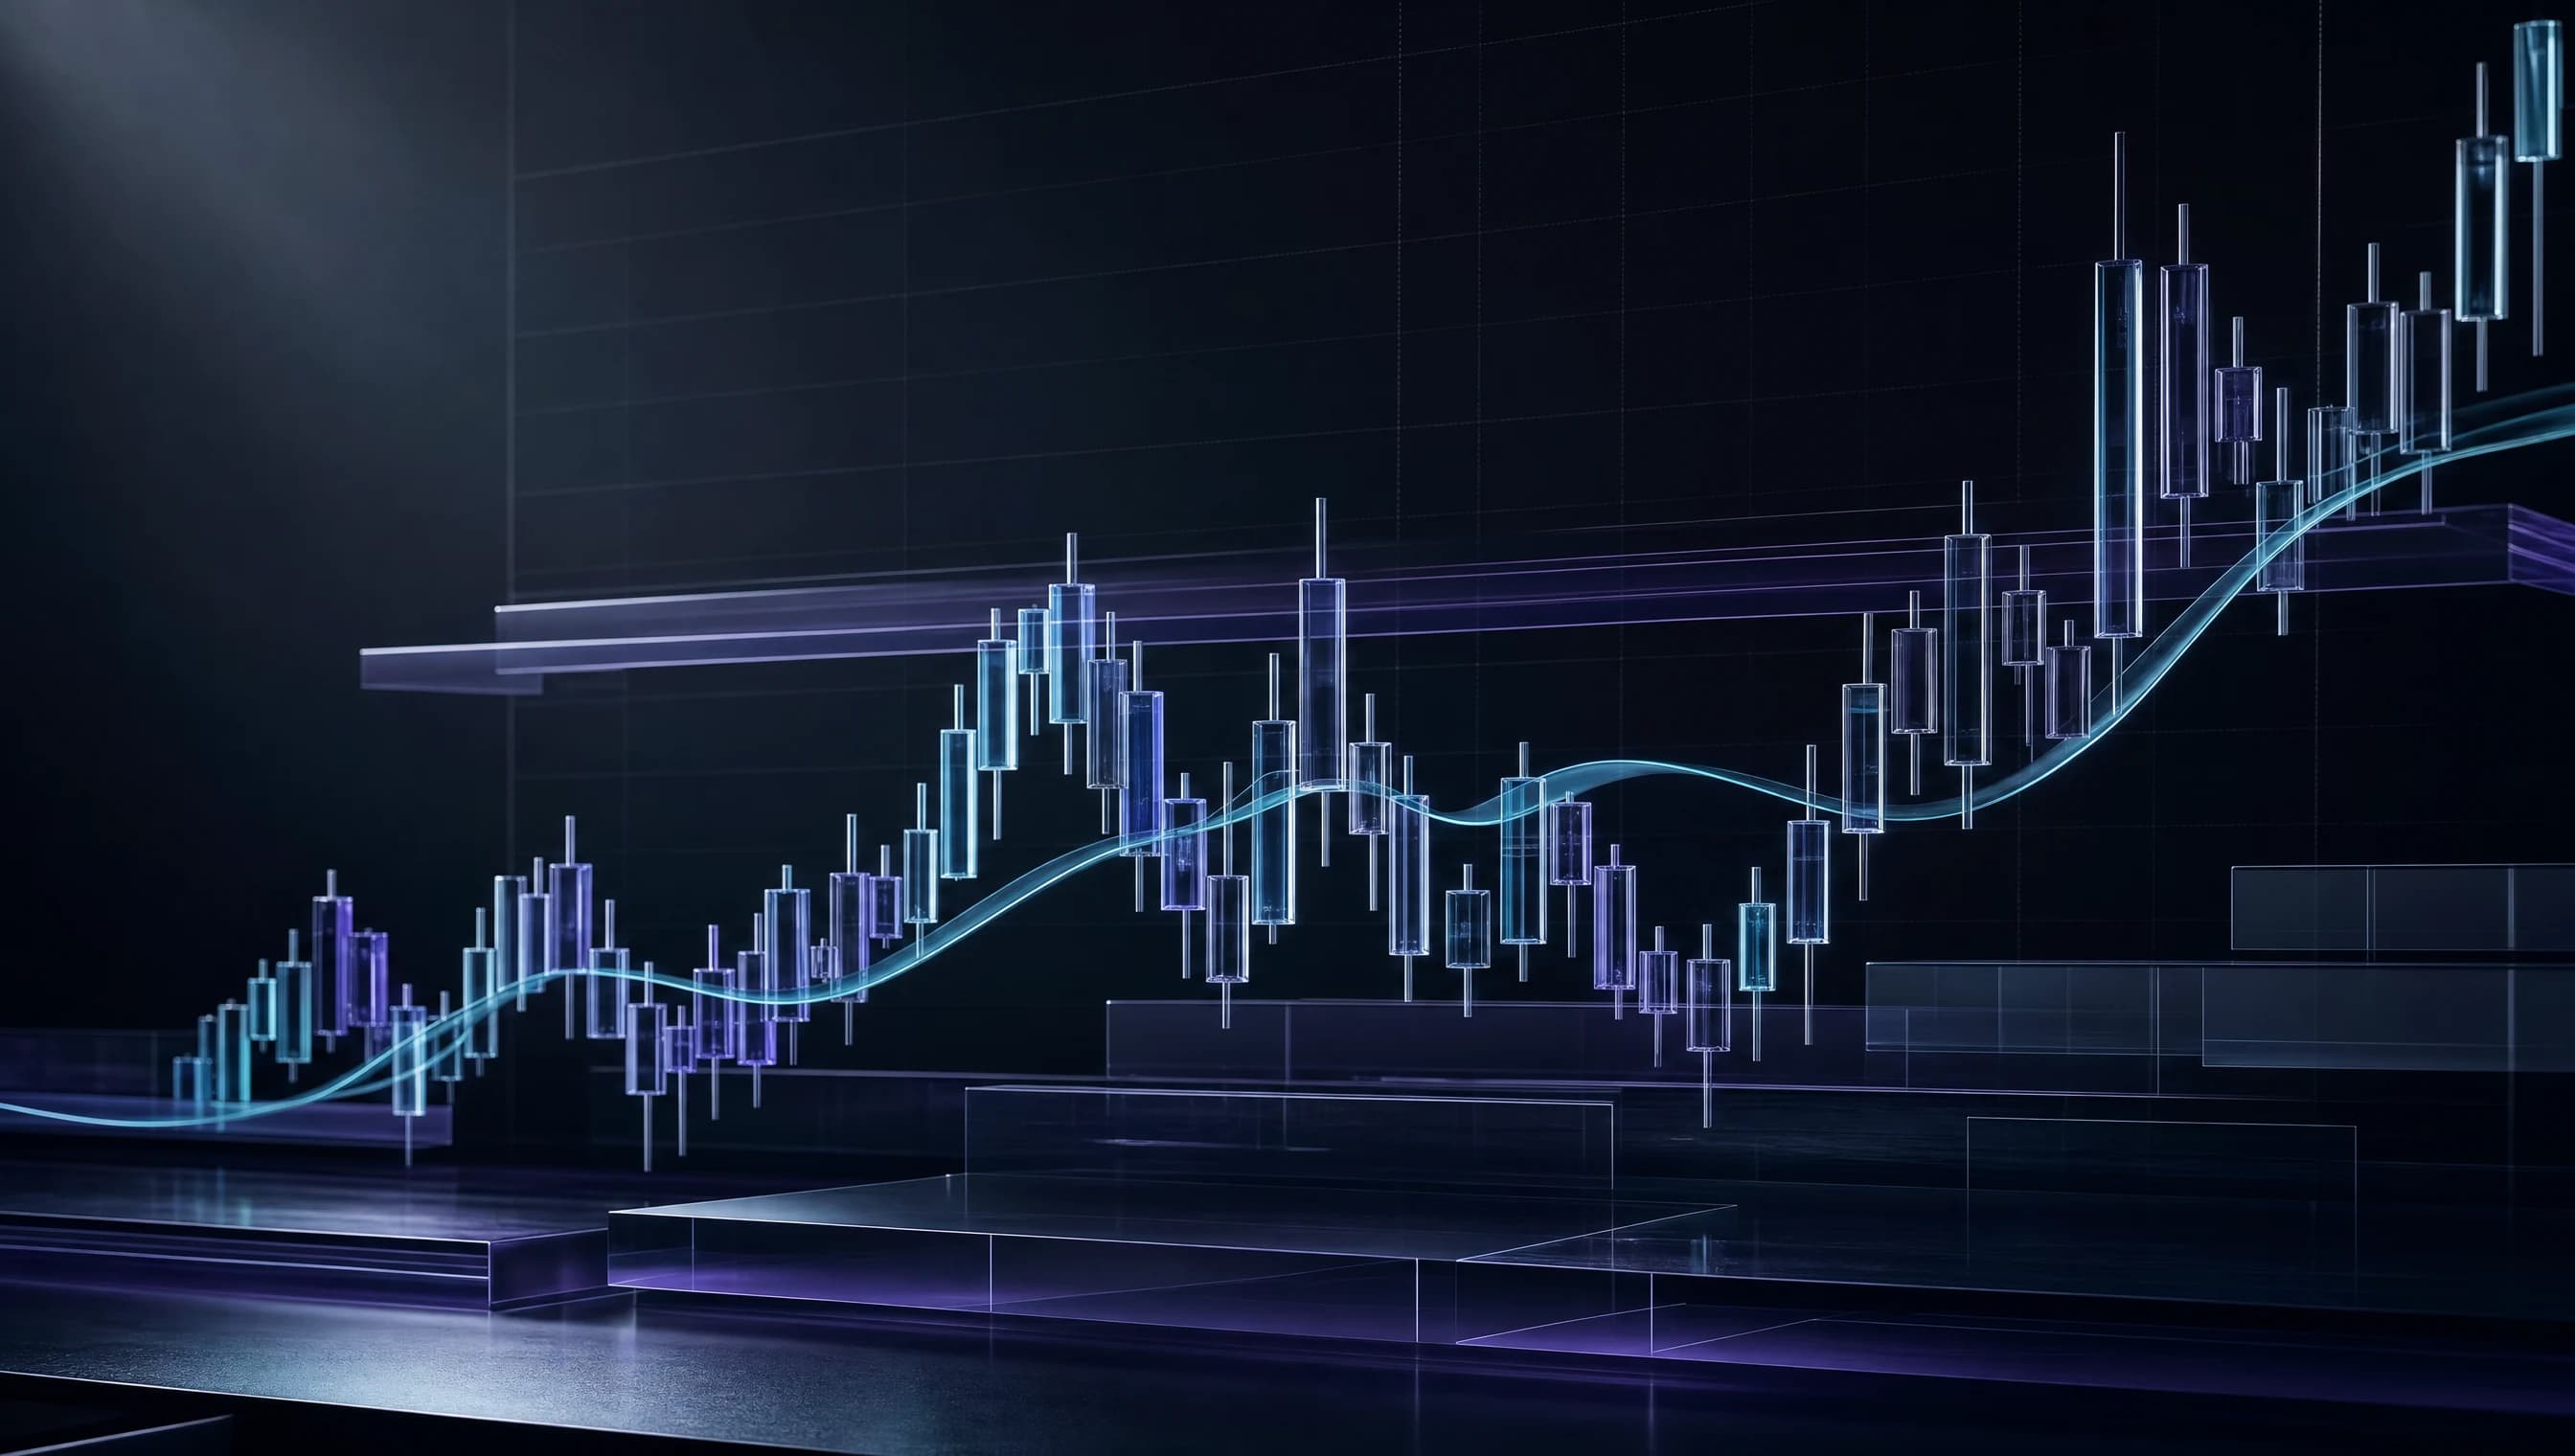
Illustrative chart
Moving Average Smoothing Window
What to notice
The average follows the direction of price but turns later because every value summarizes completed observations.
Common mistake
Treating a crossover as a prediction instead of a delayed description of a move already underway.
A moving average replaces a sequence of changing prices with a smoother line. It does not estimate fair value or predict the next observation. Instead, it answers a narrower question: what has the selected price series averaged under a stated weighting rule? That summary can make direction and regime changes easier to see, provided the analyst remembers that every point is built from historical data.
What a moving average measures
The input is usually closing price, although an average can be built from highs, lows, typical price, volume, or another series. The lookback controls the trade-off. A short lookback reacts quickly but preserves more noise; a long lookback is smoother but responds later when conditions change.
For an (n)-period simple moving average (SMA):
SMA = (P1 + P2 + ... + Pn) / n
When a new period arrives, the oldest observation leaves the window. This rolling replacement is why the line “moves.” A 20-period average on daily data and a 20-period average on hourly data describe very different horizons, even though both use 20 observations.
Know the main weighting choices
An SMA gives every observation in its window equal weight. A weighted moving average assigns explicit weights, commonly increasing them toward the newest price. An exponential moving average also emphasizes recent data, but its weights decay gradually and do not fall to zero at a hard window boundary.
The choice changes responsiveness, not the underlying evidence. A faster average can recognize a move sooner, but it can also react to a temporary jump. A slower average filters more variation, but part of a move may already be complete before its slope changes. Comparing methods is meaningful only when the input, timeframe, session rules, and lookback are held constant.
Read slope, location, and separation
Three observations are common. First, a rising average indicates that the weighted historical series is increasing; a falling average indicates the opposite. Second, price above an average shows that the latest price exceeds that historical summary. Third, the distance between fast and slow averages shows how differently two lookbacks are behaving.
A crossover occurs when a faster average moves through a slower one. It confirms that recent prices have shifted enough to reorder the averages, but it is not proof that a durable trend has begun. Crossovers are generally late by construction. Their interpretation improves when paired with market structure, volatility, participation, and a defined time horizon.
Worked example: a rolling window
Consider five closing prices: 98, 101, 103, 102, and 106. The five-period SMA is:
(98 + 101 + 103 + 102 + 106) / 5 = 102.00
The three-period SMA uses only 103, 102, and 106:
(103 + 102 + 106) / 3 = 103.67
The shorter average is higher because the latest three observations are stronger than the full five-period sample. If the next close is 109, the oldest value, 98, leaves the five-period window:
(101 + 103 + 102 + 106 + 109) / 5 = 104.20
The new three-period SMA is (102 + 106 + 109) / 3 = 105.67. Both rise, and the faster line remains above the slower line. That is a factual description of the sample—not a guarantee that 109 will hold or that the next close will be higher.
Practical moving-average checklist
Before interpreting a line:
- Record the input series, timeframe, lookback, weighting method, and treatment of missing sessions.
- Identify whether the market is trending, ranging, or moving through an event-driven gap.
- Inspect slope and price structure instead of relying on a crossover alone.
- Compare signal timing with realistic spread, slippage, and order latency.
- Test the same rule across varied regimes, including quiet and volatile periods.
- Avoid selecting a lookback solely because it fits one historical chart.
- Define what would invalidate the interpretation before observing the outcome.
Consistency matters because changing a 50-period average to 47 periods after seeing the chart converts analysis into curve-fitting.
Limitations and false signals
Moving averages lag because they summarize completed observations. In sideways markets, price can cross the same line repeatedly, creating whipsaws and accumulated transaction costs. A sharp gap can pull a fast average toward an extreme that soon reverses. A long average may understate a sudden change in volatility or market structure.
Results also depend on data construction. Adjusted and unadjusted equity prices, continuous futures contracts, trading-session boundaries, and thinly traded prints can produce different averages. An average that appears to act as support is not a barrier; orders may cluster nearby, yet price can pass through without trading at the line. Combining several highly similar averages does not necessarily provide independent confirmation because they are transformations of the same price history.
Key takeaways
- A moving average is a historical smoothing tool, not a forecast.
- Shorter lookbacks react faster and usually produce more noise.
- Slope, price location, and fast–slow separation describe different features.
- Crossovers can confirm a change only after enough price movement has occurred.
- Stable definitions and regime-aware testing matter more than a visually perfect lookback.
This guide is for general education only and is not personal investment advice or a recommendation. Technical signals can fail, and trading involves loss, gap, liquidity, and execution risk; leverage can magnify those risks.
Sources and further reading
Editorial review completed 16 July 2026.